-
English


A spherical LED display can look perfect while playing a bright promotional video. Colors are strong, motion is smooth, and no obvious dark area appears.
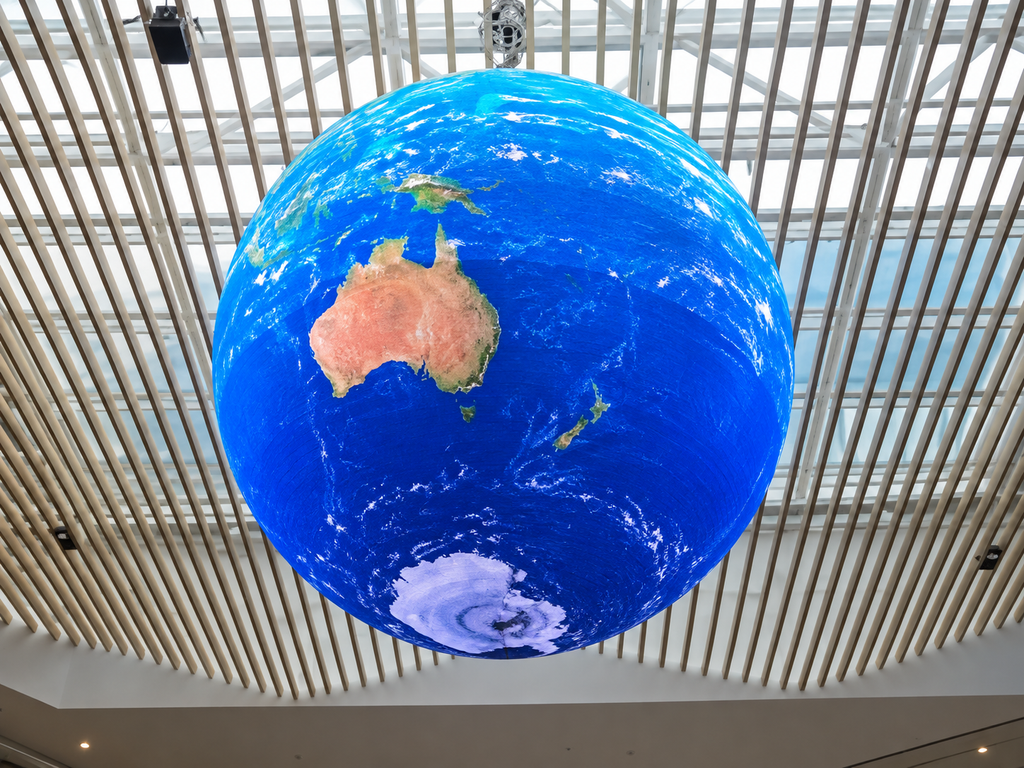
Then a 5% gray image is displayed, and suddenly a ring, patch, color shift, or module boundary becomes visible.
This does not mean the screen suddenly developed a problem. In many cases, the problem was already there. Normal video simply made it difficult to see.
For factory testing and project acceptance, low-gray test patterns are therefore much more useful than playing attractive video content.
Normal video contains movement, bright colors, changing contrast, and complex images.
These elements make small differences between LED modules difficult for the eye to compare.
For example, one section of a spherical LED display may be slightly darker than the modules around it. During a colorful advertisement, the difference may disappear because the content is constantly changing.
A static low-gray image removes these distractions.
Every part of the sphere receives almost the same image signal. If one area responds differently, the difference becomes much easier to identify.
This is why promotional video should not be the only acceptance test for a custom LED sphere.
LED modules that appear similar at high brightness may behave differently when the driving level becomes very low.
At 3%, 5%, or 10% gray, a technician may notice:
This may point to module consistency, calibration coefficients, LED batch differences, or driver settings.
On a flat LED wall, a small difference may appear as a rectangular patch. On a spherical LED display, the same difference may form a curved band around the surface, making diagnosis more difficult.
Gray should look neutral.
If one area becomes slightly red, green, or blue under low-gray testing, the RGB channels may not be responding equally at low output levels.
A full-white test may not expose this clearly because all three channels are operating at a much higher level.
For this reason, testing only white, red, green, and blue is not enough.
A useful test sequence should also include:
1% → 3% → 5% → 10% → 20% → 50% gray
A smooth gray gradient can also help identify where the change begins.
Pixel or module calibration is used to improve brightness and color consistency.
However, incorrect calibration data can sometimes make one group of modules behave differently from another.
This becomes especially important if modules have been moved, receiving cards replaced, or configuration files reloaded.
If the difference follows a clear group of modules instead of the physical viewing angle, check the calibration data before replacing hardware.
A related problem can occur when the software configuration no longer matches the actual physical signal path. You can read more in our guide on why a spherical LED display can look correct in the control software but wrong on the physical screen.
Not every low-gray difference is an electrical failure.
A sphere is viewed from many angles at the same time.
Modules near the side, top, or bottom of the sphere may face the viewer differently. Small structural alignment differences can therefore change the perceived brightness.
There is a simple way to separate this from a real module problem.
Display a low-gray pattern and walk around the sphere.
If the dark area stays on the same physical modules, investigate the modules, calibration, receiving cards, or power system.
If the apparent band changes as your viewing position changes, the cause may be related to curvature, module angle, or surrounding light.
This distinction can prevent unnecessary module replacement.
For factory inspection, do not simply display one gray image.
Use a repeatable sequence.
Run the spherical LED display for a period before final inspection so that testing is not based only on cold-start conditions.
Strong spotlights or direct sunlight can make one part of the sphere appear brighter than another.
Where possible, test under controlled lighting.
Check black, very low gray, medium gray, and higher gray levels.
Pay special attention to approximately 3–10%, where small uniformity differences may become easier to notice.
Run dark red, dark green, and dark blue patterns separately.
If an abnormal area appears only in one color, this gives the technician a much narrower direction for troubleshooting.
Do not simply report that “one side looks darker.”
Mark the affected module number, receiving-card area, or physical position on the sphere.
Take photos from the same reference position whenever possible.
This makes later comparison much more useful.
The shape of the abnormal area often provides clues.
A single rectangular patch may point toward a module or receiving-card area.
A continuous ring around the sphere may require checking module groups, calibration, structural angles, or assembly zones.
A color change visible only at low gray suggests that RGB response or calibration needs closer inspection.
An abnormal area that changes with viewing position is more likely to involve geometry or viewing angle.
If the problem appears mainly after installation but was not obvious during factory inspection, compare the test conditions first.
Imagine a 2-meter LED sphere being tested before shipment.
A colorful promotional video looks completely normal.
The engineer then displays 5% gray.
A faint brighter band appears around part of the middle section.
Instead of immediately replacing modules, the team checks the same area with 3%, 10%, 20%, red, green, and blue patterns.
The band remains in the same physical area.
This gives the engineer useful evidence to compare module calibration, receiving-card grouping, module batches, and physical installation before the display leaves the factory.
Finding the issue at this stage is much easier than discovering it after the sphere has been installed several meters above the floor.
Video contains changing brightness, colors, and motion that can hide small uniformity differences. A static gray field makes neighboring modules easier to compare.
No. Full white is useful for checking brightness, power behavior, and obvious differences, but some problems are much easier to see at low gray.
There is no single level that finds every problem. Using several levels such as 1%, 3%, 5%, 10%, 20%, and 50% provides much more useful information.
No. Calibration, viewing angle, configuration, receiving-card grouping, structure, and environmental lighting should also be checked before replacing hardware.
A spherical LED display should not pass inspection simply because a promotional video looks attractive.
Low-gray testing gives engineers a much cleaner view of how the modules actually behave.
At TOOSLED, spherical and custom-shaped LED displays can be tested with multiple static patterns before shipment, including grayscale, RGB, mapping, and uniformity checks.
The goal is simple: find small inconsistencies while the screen is still in the factory, where they are easier to diagnose and correct.
For a 360-degree display, the details that are hardest to see during normal video are often the details most worth testing.
+86 18688923792
+86-755-23312336
4th Floor, Building B, Zhonghe Building, Taiwan Industrial Zone, 2132 Songbai Road, Shiyan Street, Bao'an District, Shenzhen.


Emall us with any questions or inquiries or use our contact data.We would be happy to answer your questions.
Toosen Professional Manufacturer of led sphere display,led screen globe,led ball display,spheric led screen,spherical led display, Led Special-shaped LED manufacturer, LED factory,Manufacturers & Suppliers,Factory & Exporters. Looking forward to your cooperation.
Copyright © 2010-2026 Toosen LED All Rights Reserved
Theme by WordPress