-
English


What changed between the factory test and the final installation?
For a spherical LED display, the answer may involve mechanical assembly, power distribution, calibration data, viewing angle, ambient light, or a combination of several factors.
Factory testing takes place under relatively controlled conditions.
The sphere may be completely assembled before shipment. Engineers can check module positions, power connections, receiving card settings, and display calibration in the same environment.
The project site is different.
A large LED sphere may need to be separated into several sections for transportation and assembled again on site. Cable routes may become longer. The final mounting position may be several meters above the floor. Nearby windows, spotlights, or skylights may also change how the surface looks.
That is why passing a factory test does not guarantee that the visual result will remain exactly the same after installation.
The first troubleshooting step should therefore be to compare the two conditions instead of immediately replacing LED modules.
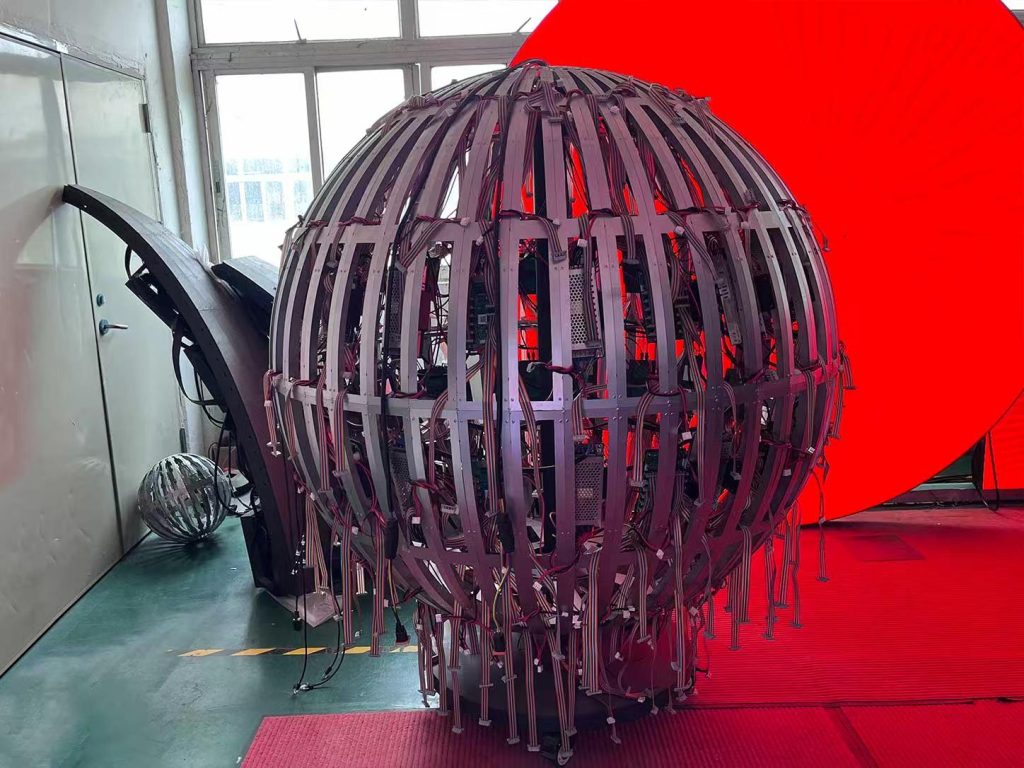
A spherical screen has no flat reference surface.
Each module follows a different part of the curvature, so small changes in position can become more noticeable than they would on a conventional flat LED wall.
If part of the sphere is removed for transportation and installed again, check whether:
A brightness band may sometimes be an optical effect caused by geometry rather than a real difference in LED output.
This is especially important when the band follows a clear ring around the sphere.
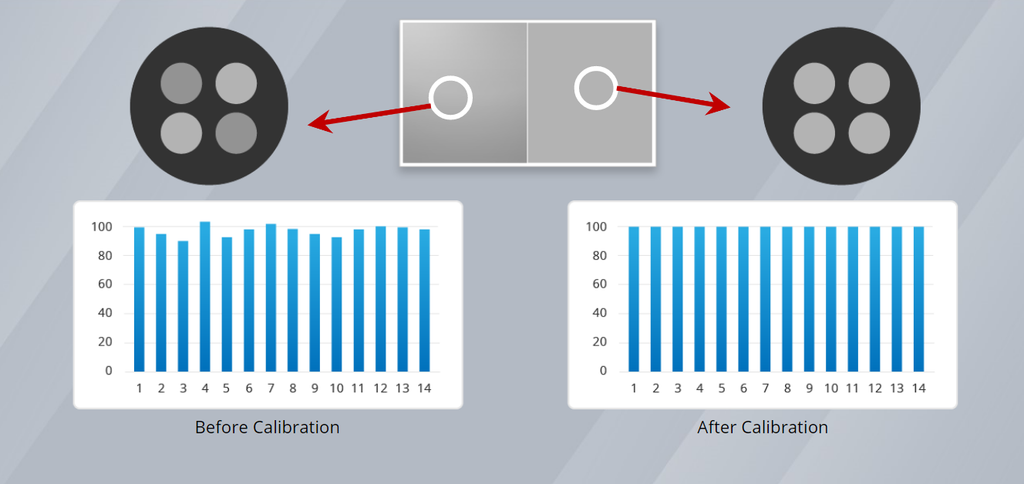
LED modules naturally have small differences in brightness and color. Calibration compensates for these differences and helps the finished display appear uniform.
However, the correction data used during factory testing must remain correctly associated with the display after installation.
Problems can appear if a receiving card is replaced, configuration files are reloaded, modules are moved to different positions, or calibration coefficients are not restored correctly.
Before performing a new calibration, compare the current configuration with the factory backup.
If the hardware is unchanged but one area suddenly looks different after configuration work, checking calibration data is often faster than dismantling the sphere.
A screen can receive stable power on the factory floor but use a very different electrical layout at the installation site.
The final project may have longer cable routes or a different distribution arrangement. Under a bright full-screen image, the load also becomes much higher than it is with ordinary video content.
If a suspicious area becomes darker mainly during high-brightness scenes, measure the power conditions in that section under load.
Do not judge the system only while displaying a dark video.
A useful comparison is:
black screen → normal video → 50% gray → full white
If the brightness difference becomes much stronger as the load increases, the investigation should include the power path rather than calibration alone.
Not every visible band comes from the screen itself.
A sphere reflects and emits light in many directions. At the installation site, one side may face a glass façade while another faces a darker interior. Ceiling spotlights may illuminate the upper part of the sphere, while the bottom remains in shadow.
From one position, this can look like an LED brightness problem.
Before changing hardware, turn off nearby controllable lighting where possible and observe the sphere from several positions.
If the band changes significantly when the viewer moves, the cause may involve viewing geometry or ambient light rather than a failed module.
Random video is not ideal for diagnosing brightness bands.
Use several simple test images:
This makes large brightness differences and power-related problems easier to see.
Gray is useful for finding smaller uniformity differences that may be hidden at maximum brightness.
Display each primary color separately.
If the problem is much stronger in only one color, the issue may be related to color calibration, individual LEDs, or driver behavior rather than overall luminance.
A smooth dark-to-light gradient can reveal problems that are difficult to see on a full-white image.
After displaying these patterns, photograph the sphere from the same reference position used during acceptance testing whenever possible.
This gives the engineering team comparable evidence instead of relying on statements such as “this side looks a little darker.”
The shape and timing of the brightness band can provide useful clues.
If the band remains in exactly the same physical area under white, gray, red, green, and blue, inspect the modules, configuration, and power distribution in that area.
If it becomes obvious only under high brightness, test the electrical load and power path.
If it changes when the viewer walks around the sphere, investigate viewing angle, module alignment, and environmental lighting.
If it appears only after the display has been running for some time, record the screen condition at cold start and again after warm-up. Temperature-related changes may be involved.
This diagnostic sequence helps avoid replacing good LED modules for the wrong reason.
For custom LED projects, factory testing should create a reference for future troubleshooting.
Useful records include:
When the display reaches the project site, technicians can compare the installed system against this reference.
This is much more effective than starting the diagnosis from zero.
Not necessarily. Module alignment, calibration data, power conditions, viewing angle, and ambient lighting can all produce similar symptoms.
No. First identify whether the difference comes from hardware, configuration, power, geometry, or the viewing environment. Recalibrating too early can hide the original cause without fixing it.
Small luminance and color differences can become easier to notice at certain grayscale levels. Testing several brightness levels provides more information than checking only a full-white image.
A spherical LED display should not be treated as a collection of independent modules.
Its final visual performance depends on the relationship between the LED modules, curved structure, power system, control configuration, calibration data, installation environment, and viewing position.
At TOOSLED, custom LED displays can be checked before shipment with test patterns and system configuration records, giving installers a reference when the screen is assembled at the final site.
When a sphere passes factory testing but shows brightness bands after installation, the best response is not to start replacing parts immediately.
Compare what changed first. Test the screen systematically. Then correct the actual cause.
That approach saves installation time and helps preserve the uniform 360-degree visual effect that a spherical LED display is designed to deliver.
+86 18688923792
+86-755-23312336
4th Floor, Building B, Zhonghe Building, Taiwan Industrial Zone, 2132 Songbai Road, Shiyan Street, Bao'an District, Shenzhen.


Emall us with any questions or inquiries or use our contact data.We would be happy to answer your questions.
Toosen Professional Manufacturer of led sphere display,led screen globe,led ball display,spheric led screen,spherical led display, Led Special-shaped LED manufacturer, LED factory,Manufacturers & Suppliers,Factory & Exporters. Looking forward to your cooperation.
Copyright © 2010-2026 Toosen LED All Rights Reserved
Theme by WordPress